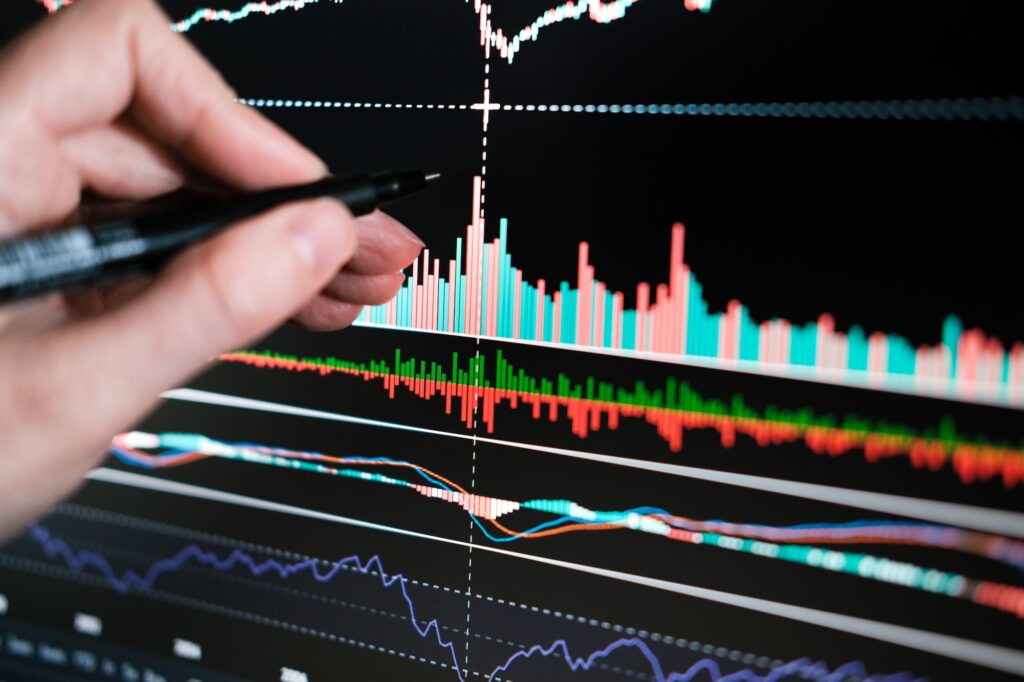
Trading indicators are essential tools that help investors make informed decisions by analyzing price movement, volume, and market trends. While no indicator is perfect on its own, combining the right ones can give traders a clearer picture of where the market might be heading. Whether you’re a beginner or a seasoned investor, understanding these top trading indicators can enhance your strategy and boost your confidence in the markets.
One of the most widely used indicators is the Moving Average (MA). It smooths out price data to identify trends over a set period, helping traders spot reversals or confirm existing momentum. Another popular tool is the Relative Strength Index (RSI), which measures the speed and change of price movements to identify overbought or oversold conditions—critical for timing entries and exits.
MACD (Moving Average Convergence Divergence) is a trend-following momentum indicator that shows the relationship between two moving averages. It’s useful for spotting changes in strength, direction, and momentum. Likewise, Bollinger Bands are a favorite among volatility traders. These bands expand and contract based on price volatility, helping investors identify potential breakouts or consolidations.
Other valuable indicators include Stochastic Oscillator, Fibonacci Retracement, Ichimoku Cloud, Volume, Average True Range (ATR), and Parabolic SAR. Each has its own unique strengths and is suitable for different trading styles, such as scalping, swing trading, or long-term investing. When used in combination, these indicators can provide powerful confirmation signals and help reduce false entries.
Understanding and properly applying these top 10 trading indicators can greatly improve your market analysis and decision-making. While they don’t predict the future, they offer structure, clarity, and insight—giving investors a strategic edge in navigating complex market conditions.


